Saturday, August 31, 2019

Lupine Publishers: Lupine Publishers | Forced Traction: An Error

Lupine Publishers: Lupine Publishers | Forced Traction: An Error: Lupine Publishers | Journal of Veterinary Science Introduction Immediate cause of dystocia requires certain preparations an...

Lupine Publishers| Optimization of Waste Discharge Points in Natural Streams

Lupine Publishers | Civil Engineering Research Journal

Abstract

This paper reports on a study carried out to optimize the locations of multiple discharge points in a receiving stream, Amadi creek, so as to minimize the impact of oxygen demanding resources (BOD) on water quality. The study evaluated the water quality changes as a result of the increasing human and industrial activities around the creek. Water quality standards require the maintenance of dissolved oxygen (DO) concentration of 5mg/l or more at any time in streams. However practical analysis of the water samples from Amadi creek reveal a DO level as low as 2.3mg/l. The DO deficit was computed from data generated by sampling DO concentrations along the creek from various points of waste discharge downstream while the BOD of the stream was determined by monitoring BOD of samples obtained along the creek. The study also identified and quantified the amount of effluent entering the creek from various point sources. The DO deficit equations are solved by the methods of simple calculus (classical optimization), which simplifies the mathematical solution of the model equations by avoiding difficult to evaluate integrals Two scenarios were identified and used to investigate the effect of BOD on the DO level in the stream, using mathematical simulation techniques. Simulation results show that to ensure minimum impact of BOD on water quality waste discharge locations should be placed at the optimal locations of 10015.382m and 6992.282m upstream and downstream waste discharge points respectively, at an optimum DO deficit of 4.135mg/l for case 1.
For case2, the waste discharge locations are to be placed at optimal locations 40995.43m, 30665.17m, 41233.69m upstream and downstream waste discharge points respectively at an optimum DO deficit of 4.567mg/l. This means that if a new waste input is proposed for a stream its BOD input and its proposed location with respect to other inputs are important in order to determine the effect on the DO level in the stream Discharges from the second treatment plant would result in decreased dissolved oxygen level for a substantial distance downstream. This can have significant effects for streams and rivers with many influent waste streams over their course, as the dissolved oxygen (DO) will not have a chance to recover between each influent stream, resulting in significantly depressed oxygen levels .The dissolved oxygen (DO) deficit becomes zero at approximately the same distance downstream for both cases, though the two point source discharge case (case2) shows a higher short term DO deficit. This can cause problems if they DO concentration drops below the stipulated levels for the creek, leading to possible death of fish and other aquatic lives. It is therefore recommended that industrial establishments planning to site their treatment facilities along rivers or streams should be compelled to discharge their waste stream in compliance with the optimal locations with respect to any existing plant, so as to avoid undue dissolved oxygen (DO) depletion.
Keywords: Point Sources; Effluent; Discharge Point; Impact, Creek; Optimal Location; Sampling

Introduction

Modeling the impact of Biological Oxygen Demand (BOD) on water quality is an important part of the permitting process for new resources Masters [1]; Agunwamba et al. [2]; Peavy et al. [3]. Many rivers and streams in Port-Harcourt metropolis, Nigeria as a whole and indeed all over the world have suffered from dissolved oxygen (DO) deficit, which is very crucial to survival of aquatic life. Stream models can help determine the maximum amount of additional BOD that will be allowed, which, in turn, affects facility siting decisions and the extent of on-site waste water treatment that will be required Agunwamba et al. [2]; Mcbride [4] ; Ezeilo et al. [5]; Dobbins [6] .The amount of dissolved oxygen (DO) in water is one of the most commonly used indicators of a rivers health ( Ezeilo et.al, 2012 ). As DO drops below 4 or 5 mg/l, the forms of life that can survive begin to be reduced. In the extreme case when hypoxic conditions (0<DO<5mg/l) exist, most higher forms of life are killed or driven off. Among the factors affecting the DO available in a stream are BOD, which account for the oxygen demanding wastes Brown [7]; Ezeilo et al. [8], Ezeilo et al. [9]. Photosynthesis also affect DO. Algae and other aquatic plants add DO during the daytime hours, while photosynthesis is occurring, but at night their continued respiration draws it down again. The net effect is a diurnal variation that can lead to elevated levels of DO in the late afternoon and depressed concentrations at night. For a lake or a slow-moving stream that is already overloaded with BOD and choked with algae, it is not unusual for respiration to cause offensive, anaerobic conditions late at night, even though the river seems fine during the day. Other factors which would affect DO availability in a stream include, accumulated sludge along the bottom, tributaries, which mix with those of the mainstream. etc. Water quality modeling in a river has developed from the pioneering effort of Streeter and Phelps [10], who proposed a mathematical model demonstrating how DO in the Ohio River decreased with downstream distance due to degradation of soluble organic BOD.
According to Yudianto et al. [11] the simplest manifestation of this equation is usually applied for a river reach characterized by plug flow system with constant hydrology and geometry under steady state condition, as occurred in Amadi creek. For a large river or estuary, considerable longitudinal dispersion influences the phenomenon of DO and BOD distribution and so the governing equations becomes a partial differential equation. However, the effect of dispersion on DO and BOD in small rivers, like Amadi Creek, used in this study, is negligible Li [12]. Water collected for sampling is discharged into Amadi creek without any treatment as point source. Therefore, specifically Amadi creek is modeled with single point source of BOD in this study. Much research has been done on the area of DO depletion in water bodies, providing information on critical deficit, critical distance, and minimum DO concentration, but none of these studies has attempted to optimize the waste discharge locations for minimum impact of oxygen demanding resources (BOD) on water quality. This would have enabled us to establish an optimum deficit and optimum discharge locations for minimum impact of oxygen demanding resources on water quality. Such a study has been undertaken in Amadi Creek. This research was therefore carried out to identify and quantify the amount of waste water effluent entering the creek and evaluate the impact of these oxygen demanding wastes on water quality. A novel approach that will help minimize stream pollution when there are many industries discharging waste water into a stream is presented. Also, the determination of points of maximum DO deficit in case of multiple discharges along a stream using classical optimization technique is discussed.

Brief Description of the Study Area

The Amadi Creek has the Bonny river as its major source. It flows from Okrika down to Mini-Ewa, Rumuobiakani through Woji, Oginigba, Okujagu communities and back to the Bonny river where it empties out into the Atlantic oc ean. Amadi creek is located in Obio-Akpor Local Government Area and is host to several industries and factories as well as the popular Port-Harcourt city abbatoir (Slaughter). A sketch of Amadi Creek showing point sources of pollution are shown in Figure 1.
Figure 1: A sketch of Amadi Creek showing point-sources of pollution (Agunwamba et al, 2006).
Lupinepublishers-openaccess-journals-Civil-engineering-Architechture

Methodology

Data was generated by sampling DO concentrations along the creek aboard a boat from various waste discharge locations and monitoring the BOD of samples obtained along the creek. The water temperature and pH was also determined. Other parameters determined include creek depth, width, flow velocity and flow rates. The BOD and DO were determined following the procedures given in the standard methods ( Apha,1998). Samples were collected with winkler bottles at intervals downstream, sealed to exclude air bubbles and sent to the laboratory for analysis. The depth were measured by dropping a loaded tape to the bottom of the creek, while the width was measured by stretching a tape across the creek. Temperature was measured on site using a clinical thermometer, while velocity was determined with a current meter.

Theoretical Formulation

Case 1 – One Source of Waste Water Discharge (Figure 2)
Figure 2: Two reach model of a stream with a single point-source.
Lupinepublishers-openaccess-journals-Civil-engineering-Architechture
The dissolved oxygen deficit along the reaches are:
Lupinepublishers-openaccess-journals-Civil-engineering-Architechture
where, Lo is ultimate BOD concentration upstream effluent discharge, Do initial Do concentration upstream effluent discharge
Lupinepublishers-openaccess-journals-Civil-engineering-Architechture
The concentrations just downstream are computed by a mass balance as;
Lupinepublishers-openaccess-journals-Civil-engineering-Architechture
where, Q 1, Q 2 are the stream and effluent discharges respectively. L 1, L 3 are BOD of stream upstream and downstream respectively, L 2 is BOD of Effluent discharge, D 1, 3, are the DO concentrations upstream and downstream respectively, D2, is the DO concentration of Effluent discharge. In the Streeter and Phelps derivation the differential for L is assumed as which integrates to;
Lupinepublishers-openaccess-journals-Civil-engineering-Architechture
Substituting equations (3) and (4) into eq (2), gives
Lupinepublishers-openaccess-journals-Civil-engineering-Architechture
Case 2 – Two Sources of Waste Water Discharge (Figure 3)
Figure 3: Two-reach model of a stream with two-point sources.
Lupinepublishers-openaccess-journals-Civil-engineering-Architechture
The dissolved oxygen deficit along the reach CD, gives;
Lupinepublishers-openaccess-journals-Civil-engineering-Architechture
where, Q4, Q5, are the stream and Effluent discharge respectively, L4, L6, are BOD upstream and downstream respectively, L 5 is BOD of Effluent discharge, D4, D5 are the DO concentrations of stream and Effluent respectively.
Substituting equations (7) and equation (8) into equation (6) gives:
Lupinepublishers-openaccess-journals-Civil-engineering-Architechture
Assumptions
a) The main assumption in the formulation of the equations is that the river reach is characterized by plug flow system with constant hydrology and geometry under steady state condition and is traveling at a constant speed (u).
b) It is also assumed that water temperature is constant throughout the stream. Mixing of different temperature streams is not accounted for.
c) It is assumed that there is a constant discharge of waste water into the creek and also that the waste water is discharged into Amadi creek without any treatment as point source. Therefore, specifically Amadi creek is modeled with single point source of BOD in this study.
Optimization Problem
The problem of searching for the optimal waste discharge locations, for minimum impact on water quality may be expressed (Figures 2 & 3) as;
Lupinepublishers-openaccess-journals-Civil-engineering-Architechture
Subject to, t1>0, t2>0
where, X1 and ho are the optimal waste discharge locations
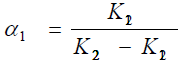
Equations (5) and (6) represents the mathematical models for the stated problem. This is an optimization (maximization) problem Nwaigwe [13]. The desired solution of the above problem involves the search for the optimal values of the waste discharge locations i.e. the optimal determination of the values of x1 and ho for each waste discharge point. This can be solved by the method of simple calculus as follows;
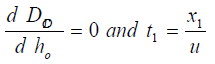
Case 1: The derivative of equation (5) when
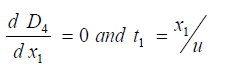
 is
Lupinepublishers-openaccess-journals-Civil-engineering-Architechture
Where
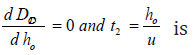
The derivative of e. q (5) when is
Lupinepublishers-openaccess-journals-Civil-engineering-Architechture
Where
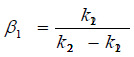
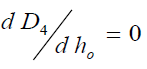
Hence the optimal locations X1 and ho at which the waste discharge locations will be placed for minimum impact on water quality are obtained by solving equations (11) and (12) as;
Lupinepublishers-openaccess-journals-Civil-engineering-Architechture
where X2 is the downstream location, and u is the average stream velocity, while t3 is the time of travel.
The derivative of e q (10) when
Lupinepublishers-openaccess-journals-Civil-engineering-Architechture
The derivative of eq when
Lupinepublishers-openaccess-journals-Civil-engineering-Architechture
Hence the optimal locations X1, ho and X2 at which the waste discharge locations will be placed for minimum impact on water quality are obtained by solving equations (13), (14), (15) as;
Lupinepublishers-openaccess-journals-Civil-engineering-Architechture
x1, ho and x2 are the optimal waste discharge locations and Q4 , Q5, are the Stream and Effluent discharges respectively. L5 and D5 are the Effluent BOD and DO concentrations respectively. K13, k23 are the de oxygenation and re aeration rates respectively. As previously mentioned when eqn (1) and eqn (6) are assumed to be steady state, time (or distance) is the only independent variable. Equations (5) and (6) are the mathematical models for the problem of optimization of the waste discharge locations in rivers. These equations can be solved for the root t by a numerical root finding method in a software package such as MATHCAD or MATEMATICA. The value of t is then substituted into eqn (5) or eqn (6) to calculate the optimum DO deficit. An alternative procedure to finding the optimum DO deficit is to apply a series of times or velocities in eqn (5) and eqn (6) and record the value of the optimum DO deficit and the times or velocities to which it corresponds Nwaigwe [13]. Since the DO equations contain both DO deficit and t (which is a function of DO), the solution is thus arrived at by iteration using the Newton- Raphson method with the help of a developed VISUAL BASIC Programme.

Application of Models

The developed models were applied to the water quality data for Amadi Creek (Table 1). The input data for simulations of the two case studies are;
Table 1: Amadi Creekwater Quality Parameters Agunwamba et al. [2].
Lupinepublishers-openaccess-journals-Civil-engineering-Architechture
Case 1: Q1 = 0.139m3/s, Q2 = 0.5m3/s, Lo = 7.59 mg/l, Do = 4.1 mg/l
k11 = 0.1/day, k12 = 0.17/day, L2 = 20mg/l, k21 =0.17/day k22 = 0.23/day.
Case 2: Q5 = 0.65m3/s, L2 = 25 mg/l, D5 = 3.4 mg/l, k13 = 0.26/ day, k23 = 0.42/day
Substituting the above values in the above equations gives the optimal locations X1 and ho as10015.382m and 6992.282m respectively, at an optimum deficit of 4.135mg/l for case 1.Thus the model predicts that at an optimum deficit of 4.135mg/l the waste discharge locations would have to be placed at 10015.382m and 6992.282m upstream and downstream waste discharge locations respectively for minimum impact on water quality. For case 2, substituting these values in the above equations results in an optimum DO deficit of 4.567mg/l at optimal locations of 41233.43m, 40995.17m, 30665.69m upstream and downstream waste discharge locations respectively, to ensure minimum impact on water quality. The DO, BOD and temperature of the mixture effluent with creek water was obtained.
From
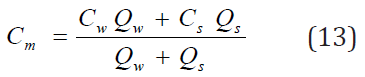
where Cm represents concentration of any parameter such as DO, BOD and water temperature at the point effluent mixes with creek water. The subscript denotes stream (or creek) and waste water respectively and Qs is the stream flow rate and Qw is the waste water flow rate. In order to convert BOD5 to ultimate BOD (Lo), using the first order decay rate, an extrapolation can be made according to Agunwamba et al. [2], as follows:
Lupinepublishers-openaccess-journals-Civil-engineering-Architechture

Effect of Flow conditions on Single Point Source Discharge

Figure 4: Effect of flow conditions on a single point waste discharge.
Lupinepublishers-openaccess-journals-Civil-engineering-Architechture
The result of the single point source case is presented in Figure 4. As expected the DO deficit curve rises to the point of optimum (maximum) deficit as the BOD is being degraded, and then start decreasing as the effect of the waste stream is felt approximately10000 meters downstream of the outfall. Here the stream becomes super-saturated due to the increased production of oxygen. This increased DO concentration may have been due to the activities of phytoplankton species living in the water (Ezeilo et.al 2012), and enhanced re aeration due to the optimum deficit of 4.135 mg/l. At this point, which corresponds to the point of maximum deficit, the stream undergoes a high level of re aeration. This is because DO deficit is the driving force for the replenishment of oxygen in polluted waters Sakalauskiene [14]. Thus, the greater the deficit, the greater the transfer of oxygen into the water Agunwamba [2]. After the point of maximum deficit, and high re aeration, the stream once again experiences a fall in the deficit as we move downstream, due to lesser concentration of the BOD, leading to improved DO concentrations, and so the DO equilibrates at a much higher concentration than in the two-point case. However, if there are other point sources downstream from the sewage treatment plant, the combined effect could cause significant depression of the stream DO concentration.

Effect of Flow Conditions on Two Sequential Point Source Discharge

The result of the two-point source discharge is presented graphically in Figure 5. They show the combined effect of a second sewage treatment plant some distance downstream. This second outfall is located in the region affected by the first out fall. The result shows a lowered DO deficit curve, shifting appreciably by the remaining DO deficit from the first outfall. This may have been due to increase in stream flow from the addition of the first out flow Ezeilo et al. [3]. This is also seen in the small change in the slope curve at the point of discharge. The second effluent stream results in a lowered DO concentration further downstream than for the single point case .This drop in the DO concentration could cause problems adjacent to the outfall if they DO concentration fall below the minimum standards set for the stream as observed by Brown [5] Due to increased effluent waste stream, very little oxygen is retained in the stream, resulting in a depressed DO deficit curve .Additionally, due to increased velocity, the travel time has significantly decreased and the resultant effect is a depressed DO concentration farther downstream than for the single point source case.
Figure 5: Effect of flow conditions on a single point waste discharge.
Lupinepublishers-openaccess-journals-Civil-engineering-Architechture

Conclusions and Recommendations

The dissolved oxygen (DO) deficit is dependent on the distance between multiple waste stream inputs (waste discharge points). This means that if a new waste input ( a new sewage treatment plant for example) is proposed for a stream or creek, both its BOD input and the proposed location with respect to other inputs are important in order to determine the effects on the dissolved oxygen (DO) level in the stream Discharges from the second treatment plant would result in decreased dissolved oxygen level for a substantial distance downstream. This can have significant effects for streams and rivers with many influent waste streams over their course, as the dissolved oxygen (DO) will not have a chance to recover between each influent stream, resulting in significantly depressed oxygen levels .The dissolved oxygen (DO) deficit becomes zero at approximately the same distance downstream for both cases, though the two point source discharge case (case2) shows a higher short term DO deficit. This can cause problems if they DO concentration drops below the stipulated levels for the creek, leading to possible death of fish and other aquatic lives. It is recommended that industrial establishments planning to site their treatment facilities along rivers or streams should be compelled to discharge their waste stream in compliance with the optimal locations with respect to any existing plant, so as to avoid undue dissolved oxygen (DO) depletion.

For more Lupine Publishers Open Access Journals Please visit our website: http://www.lupinepublishers.com/

For more Civil Engineering Research Journal articles Please Click Here: https://lupinepublishers.com/civil-engineering-journal/

To Know More About Open Access Publishers Please Click on Lupine Publishers https://lupinepublishers.us/


Friday, August 30, 2019

Wednesday, August 28, 2019

Thursday, August 15, 2019

Lupine Publishers | Sustainability Practices for Urban Housing Societies

Lupine Publishers | Journal of Civil Engineering Research

Abstract

Individual bungalows have given way to housing society in urban localities, where the floor area ratio is very high, most of the exposed areas are covered as pavements or parking spaces, and the population density is also very high. The pressures of modern life keep people from making intelligent and thoughtful decisions and thereby they fall prey to unsustainable social and environmental practices at their homes. A little awareness and effort from the housing society management bodies and cooperation from the residents would contribute to remedy this at the housing society level. This would set a strong example for all others to follow. Such sustainable practices, when adopted and implemented at different levels, would improve the living conditions and habitability in urban communities.
Keywords: Sustainability; Urban community; Reuse; Rainwater Harvesting; Composting; Electrical and electronic waste; Plastic

Introduction


The urban housing societies in the world, particularly in the developing countries, are becoming concrete hives for city dwellers to live in. The natural environment and greeneries get lost amidst the ever-increasing demands for greater floor areas or higher parking spaces. Generation of revenue fosters the irresponsible installation of high-paying mobile towers, which bring non-ionizing radiation right into the homes of people including elderly, children and infants. Many housing societies are facing acute water supply problems with the higher living standards of cities, and the deficit is passed on to the already meager grassy patches, plants or trees in the society premises – resulting in their slow deaths. The higher pressures of construction and deposition of construction rubbish leave the topsoil of the societies lacking fertility causing further depletion of greens. Thus, the popular practices are leading to degradation of the ambience of housing colonies and proving to be unsustainable. There are quite simple measures that can radically improve the living conditions of the housing societies without much drain of the financial resources. These require awareness, and collective responsible efforts with the infusion of some starting investments for easy implementation. In this short article, the author expresses opinion about few such aspects. These concepts have been drawn from author’s experience in Indian housing colonies. However, these would be equally relevant for other housing developments of the world, where urban man could be facing similar predicaments.

Rainwater Harvesting


Depletion of ground water is a severe problem in many cities and towns. Locations experiencing heavy rainfall also face such water scarcities because of the higher surface runoff caused by the higher proportion of built-up area in the modern urban locales. One of the remedial measures could be stopping the rainwater from freely flowing into the storm sewers and down to the rivers or seas but recharging the ground water instead. This would require very little investment and could be well managed at any level, if the will to harvest rainwater is present. There are materials available on the web [1,2]. for easy schemes and designs to suit plots of every size. Harvesting rainwater is age-old practice in many water scarce regions, where it was stored in underground rock caverns for use all year round, for example, in Maharashtra, India. Taking lessons from the ancient, modern housing societies can seriously contribute to improvement of the ground water scenario in urban neighborhoods, consequently enhancing the local flora.

Grey-Water Gardening


A huge quantity of water discharged from the kitchen and the bathrooms of the housing societies get discharged into the sewage system and lost to the rivers and seas. This is called ‘grey water’ that can be used for flushing toilets or gardening purposes with a minimum filtering operation, thereby reducing the overall water demand of the society. For the purposes of gardening, the water may be collected by a separate pipeline, passed through some graded filter media, then stored in a tank and pumped at predecided time instances. For the purposes of toilet flushing, separate flushing tanks would be required on the building tops and the grey water may be pumped from the collection tank to the flushing tank at regular intervals for subsequent use. This would require a little more involved and expensive in installation and upkeep when compared with gardening operation. Depending upon the resources available with the housing society the managing body may decide accordingly.

Biodegradable Waste Composting


Every housing society generates a good quantity of biodegradable waste each day. There is a collection system by which these are handed over to the municipal waste trucks and get dumped in the municipal dumping ground for natural degradation or incineration as the case may be. Further, for the fertilizing the soil in the housing societies for the sake of any number of plants and trees, or the lawns of grass, the societies purchase fertile topsoil or manure from the market. This can be easily remedied by a little effort, which involves composting the biodegradable wastes within the society grounds in a systematic manner and generate rich manure for the society. This would not only be an environmentfriendly and sustainable practice, but also would be cheaper for the upkeep in the long run. There might even be opportunities for sale of manure in the market for generating revenue for the society.

Abolishing Cellular Phone Tower


Now-a-days cellular phone network is a highly competitive market and the different service providers target towards maintaining equally good, if not better, network strength in all localities as compared to their rivals. The ever-increasing competition result in high density of the towers that crowd the landscape in urban neighborhood. In an effort to reduce the expenses of putting up towers, the cellular companies target the housing societies, from whom they secure lease at much cheaper rates than what they could obtain from the commercial vendors. However, this result in high radiation in the buildings around the towers, especially the top floors below the tower and the adjacent buildings in the signal path. Cellular tower radiation has numerous harmful effects on humans and these are well documented [3-5]. The task of the housing societies to curb this menace is simply to refuse permission for setting up tower in their premises to these cellular companies and this could drastically reduce the level of the cellular tower radiation within the housing society.

Electronic and Electrical Waste


Generally, people are ignorant about the hazardous nature of the electrical and electronic waste that is generated in the present day urban lifestyle of use-and-throw on a frequent basis. Thus, they end up in disposing all their e-waste with the household waste materials, which are dumped in the municipal dumping yards. Not only the precious metals present in the e-waste are lost in the municipal waste grounds in the process of incineration or natural degradation, but there are toxic materials present in the e-waste which get into the soil, groundwater and adversely affect the flora and fauna, and also the human population in the long run [6-8]. Housing societies can generate awareness regarding this hazard and develop a program for collection of the e-waste. It would take little resources to get the electronic and electrical waste properly disposed in this manner, even if it is not recycled, but it would go a long way in educating the people and setting an excellent example for other societies to follow.

Plastic Waste Management


Plastics have been identified and accepted as one of the main contributors to non-biodegradable material, which has infiltrated into the everyday existence of humans. The management would require adoption of the policy reduce, reuse and recycle. Driven solely by the meager monies that could be earned from the waste plastic materials, presently rag-pickers take the responsibility of the recycle or reuse of plastics in majority of the locations. However, the housing societies may develop plastics management policy at individual and colony levels by educating about the recycling of plastics, as also for the reduction in their uses. The segregation of the plastics may be done at individual levels and then deposited in a common repository of the society on voluntary basis. Subsequently, they can be channelized into proper recycling processes.

Conclusion


In this article, a few areas in which little efforts from individuals and housing societies could improve the general habitability of urban communities and help them adopt sustainable and environment friendly practices have been discussed briefly. These include rainwater harvesting, grey water reuse, handling of electrical, electronic and plastic wastes, management of cellular phone towers, and composting for manure. This article expresses the opinion of the author regarding the sustainability issues for urban communities.

Wednesday, August 14, 2019

Lupine Publishers | Discussion on Steel Fiber Reinforced Concretes (SFRC)

Lupine Publishers | Journal of Civil Engineering Research


Introduction


The use of Steel Fiber Reinforced Concrete (SFRC) has received a tremendous impulse in the last years in an attempt to push forward the boundaries of high-end structural applications. Generally, concrete is characterized by brittle failure, which limits the application and can be overcome by the inclusion of a small amount of short randomly distributed fibers (steel, glass, synthetic and natural) and can be practiced among others that remedy weaknesses of concrete, such as low ductility, high shrinkage cracking, low durability, etc. SFRC has the ability of excellent tensile strength, flexural strength, impact resistance, fatigue resistance, ductility and crack bridging. Therefore, it has been applied abroad in various professional fields of construction. Steel fiber reinforced concrete (SFRC) is a heterogeneous structural material comprising of typical concrete elements, with the addition of steel fibers to provide tensile resistance. These fibers are discontinuous discrete entities and are distributed and oriented randomly (nominally uniformly) throughout the concrete matrix. SFRC can be used by itself, or in conjunction with conventional reinforcing bars, depending on the application. [1]. SFRC’s are generally characterized by an enhanced post-cracking tensile residual strength due to the fiber reinforcement mechanisms provided by fibers bridging the crack surfaces [2]. This post peak tensile behavior is influenced mainly by the number of fibers effectively crossing a crack, their angle of orientation, and bonding strength properties of the type of fibers used.
Figure 1: General tensile behavior of concrete.
Lupinepublishers-openaccess-journals-Civil-engineering-Architechture
SFRCs are supposed to enhance the understanding of the material’s behaviour and will provide a basis for experimental research into the aspect of scatter in the post-cracking behaviour. It starts with the rheological properties of SFRC, since the workability can strongly influence several stages of the production process [3], and especially the strongest affect is seen on the post-cracking behavior of the composite material. The general tensile behavior of concrete is demonstrated in Figure 1 [4]. Without any fiber reinforcement, the plain concrete matrix exhibits a strain-softening response with low tensile strength and ductility. Because, due to low fracture toughness of concrete, tensile cracks may easily occur when there is an applied stress. The interfacial bond developed between the fibers and matrix makes use of the strength and stiffness of the fibers in reinforcing the brittle matrix. Once the matrix cracks, load can be still transferred across the crack faces through the steel fibers. As the load on the composite is increased, the process of fiber pullout affects load carrying capacity and further contributes to energy dissipation. It has also been known that when using a high volume fraction of fibers with a high specific surface area, the crack bridging potential and the strength of the composite are increased [5,6]. The flexural behavior of SFRC changes substantially compared to plain concrete. Depending on the amount and type of fibers used both the peak load and the ductility can be increased. Explanations will be presented for the fact that the flexural strength can be increased by virtue of fiber addition whereas this is hardly possible with regard to the compressive strength. In bending, the flexural load-bearing capacity can be increased even at low fiber volumes as long as the matrix strength. Fiber reinforced concrete has found interesting new applications in the past two decades due to its inherent superiority over normal plain and reinforced concrete in the following properties: higher flexural strength, better tensile strength and modulus of rupture, higher shear strength, higher shock resistance, better ductility and fatigue resistance, crack resistance and failure toughness [7]. Fiber-reinforced concrete has received its most increasing interest, especially with its presence in conventional concrete, improving certain mechanical properties of concrete. Different fiber types, fiber volume fractions and matrix compositions yield very different material behaviors. Even by changing the fiber content alone, the mechanical behavior of the concrete may change from being almost as brittle as plain concrete to even deflection-hardening materials.
In plain concrete, micro cracks develop even before loading, particularly due to drying shrinkage or other causes of volume change. The width of these initial cracks seldom exceeds a few microns. When loaded these micro cracks propagate and open up and due to stress concentration, additional micro cracks are formed. The micro cracks are the main cause for elastic deformation in concrete. Fiber reinforced cement and concrete were developed to overcome these problems. As a result of the incorporation of short discrete fibers cracks propagates into a slow controlled growth. This gives the cement-based materials maximum ductility overcoming its low tensile strength properties. The crack-bridging effect provided by fibers generates residual tensile strengths that improve both the durability and the toughness of concrete. It is the improvement of toughness and the crack distributing properties that motivate the use of fibers. This fact has been contributing to an increasing number of structural applications of SFRC [8]. The beneficial effects of fiber reinforcement are therefore twofold: not only are mechanical properties such as toughness and strength improved, but there are also new possibilities for optimization of materials for certain structures. Nonetheless, there is still a long way to go on the development of methods and design procedures to improve the reliability of this material.

For more Lupine Publishers Open Access Journals Please visit our website: http://www.lupinepublishers.com/

For more Journal of Civil Engineering Research articles Please Click Here: https://lupinepublishers.com/civil-engineering-journal/

To Know More About Open Access Publishers Please Click on Lupine Publishers: https://lupinepublishersgroup.com/


Friday, August 9, 2019

Lupine Publishers| Informal sector housing Scenario Analysis for Chattogram, Bangladesh: A Way Forward

  Abstract Population growth rate, urban migration and natural disasters are making, the chronic shortage of housing in the develop...