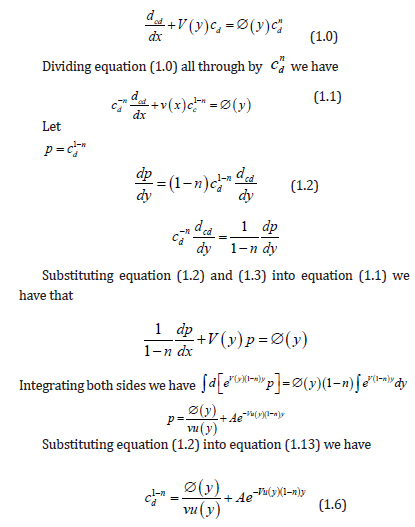
Friday, January 29, 2021

Lupine Publishers| Informal sector housing Scenario Analysis for Chattogram, Bangladesh: A Way Forward


Abstract

Population growth rate, urban migration and natural disasters are making, the chronic shortage of housing in the developing countries, more complicated and strenuous. The case of Bangladesh is no different. However, though the growth rate of Chittagong is high yet due to various infrastructural and socio-environmental issues, the people of Chittagong are facing housing shortage. In most of the cases the development of informal sector housing is makeshift, unplanned and the consideration to the geographical, environmental, and ecological matrix is minimal. People who are in the informal sector and economically disadvantaged, cannot get proper shelter due to the shortage of housing or housing ingredients for the poor. This paper attempts to find a way to mitigate the shortage of informal sector economically disadvantaged group housing within the current market scenario. A mixed income group housing subsidized for lower income category by profit sharing from other categories is recommended to make it a win-win approach.

Introduction

Bangladesh is a densely populated developing country and is facing housing shortage due to different reasons Khaled, Sultana, Biswas, & Karan [1]. The Government and other organizations are trying to solve the housing problem on a long-term basis with various strategies. As the growth rate of Chittagong is very high, proper housing and planning is essential for its sustainable development. The aim of this paper is to propose an economically viable housing scheme for the informal sector poor people in Chittagong city, particularly for displaced landslide victims, of Bangladesh for their better and safe life.

Background of the problem

Housing refers to many issues surrounding the way in which fundamental human needs for shelter and associated needs for privacy and security are met NHA [2]. For housing, political commitment is necessary to provide easy access to housing for all, ideological issues have to be addressed by adopting a policy of equity in housing, and the institutional issue refers to the methods or institution of enabling the majority households in owning or building their houses Islam N [3]. The housing situation in Bangladesh suffers from malignancy. The ancillary physical, social and economic facilities and services essential for the development of healthy and harmonious community life are highly inadequate Mowla [4] Jamil & Ahmed [5]. The unsatisfactory housing situation is further reflected in the total and per capita availability of floor space of the main living area. The average floor space per person is 3.7m2. In Dhaka around 35% of the people lived below the poverty line, out of which around 20% were classified as “hard-core poor” who lived in informal settlements Islam N [6]. This situation is a reflection of other major Cities in Bangladesh.

Housing scenario in Bangladesh

According to a recent estimate, 21% of urban households (headcount ratio) were poor (of this 7.7% were very poor); a little better than the rural households, where the poverty level was 35.2% (of these 21.1% were very poor), poverty has reduced both in urban and rural Bangladesh by approximately 7% from 2005 to 2010 (BBS-2011). Roughly 40% of low-income urban households do not have access to adequate housing Nawaz R [7]. In urban Bangladesh, estimated housing shortages were about 1.0~1.5 million, with about 500,000 dwelling units added annually Nenova T [8]. The average size of owner-occupied dwellings was (44.4sq.m) more than twice that of squatter dwellings (21.5sqm), while the average size of a rental dwelling was 35sq.m. The owner-occupied dwellings were large, but rental dwellings were overall of better quality. For instance, access to poor quality toilets in rental dwellings was only 21%, in comparison with 34% in owner-occupied dwellings. In the same way, access to drinking water from any sources maintained by the statutory bodies/non-government organizations was 35% in rental housing stock, while only 13% in owner housing stock. Rental dwellings also had better structural qualities in comparison with owner-occupied dwellings. As expected, squatter dwellings were of the worst quality, such as small size, poor structural quality and inadequate access to urban amenities Mowla [4]; Ahmad [9]. Standardization, in the Private Residential Land Development Rule 2004 is there, which provides percentages of land that must be kept for community facilities, amount of land to be sold out, area for education, health facilities, community and market, Playground and park area, road hierarchy (It also Define the width of Right of way) and importantly planning standards, for example, allocation of land per 1000 population, but unfortunately it is not monitored.

Inform sector housing scenario in chattogram at a gance

The Chattogram Statistical Metropolitan Area (SMA) covers an area of 1,152 square kilometers and consists of six metropolitan thanas. 68 wards and 236 mohallas (localities) with a population of 3.38 million. Chittagong City Corporation covers an area of 155 square kilometers with a population of 4,009,423 in 2011, which had grown on average by 3.6% per annum between 1991 and 2001(BBS). The population growth is much higher compared with national growth of about 1.6 percent. The garment industry has increased the number of females migrating into the city. 35 percent of the city’s populations are slum dwellers IDS [10].

Housing Scenario in Chittagong

Affordability

Table1 & 2 According to REHAB Chittagong Fair 2012-Survey Report almost 56% funding for buying flat/plot is from the personal and family savings where only 23% of the mortgage loan Table 3.

Table 1: Budget for an Apartment Purchase.

Lupinepublishers-openaccess-journals-Civil-engineering-Architechture

Table 2: Source of Fund.

Lupinepublishers-openaccess-journals-Civil-engineering-Architechture

Table 3: Size of Apartment among Consumers.

Lupinepublishers-openaccess-journals-Civil-engineering-Architechture

The size of apartment

It is important to consider because consumers budget is related to the apartment size. The minimum apartment size is 850sqft for the lower Income Group (LIG) where maximum size is more than 2000sqft. But most preferable apartment size is 1250 to 1550sft which is almost 50% of total demand Khaled, Sultana, Biswas, & Karan, [1]. When the apartment area increases the price also increase, though below 1000sqft is not preferable in Bangladesh context, yet for lower income and middle-income people it is within their affordable budget Table 3 & Figure 1.

Figure 1: Site Location. Source: Mapofbangladesh.blogspot. in.

Lupinepublishers-openaccess-journals-Civil-engineering-Architechture

Preference between apartment and land

To purchase a land and then construct own building is preferred because there is feeling of security with the ownership, but the land prices are high and makes it unaffordable to most. Khaled et al. [1] survey report shows, the majority of the customers (70%) prefer to buy an apartment as no construction hassle is there and also it saves time. However, 37% consumers prefer to purchase a land and construct their own building. Khaled, Sultana, Biswas, & Karan [1]. From the field survey of three residential projects in Chittagong, the construction cost of high-rise buildings (more than six storied) is found to be approximately 2000 taka/sft and for low-cost housing, it is around 1200-1300 taka/sqft.

Review of rehabilitation schemes in Bangladesh

Bhashantek rehabilitation project

Figure 2: The types of unit plan in the Bhashantek Rehabilitation Project.

Lupinepublishers-openaccess-journals-Civil-engineering-Architechture

It is a public–private partnership project undertaken in 1998 by the government to provide housing for the Slum Dwellers (SD) and Low Income Group (LIG), The project was expected to provide shelter to more than 80,000 urban poor (Figure 2). This project was the first joint venture rehabilitation project by the Government and private organization in Bangladesh. Mohit [11] summary of Project: Total land area =20 hactor, apartment units are =15024. Residential land coverage is about 58% of total land. The government is providing the total land costs about US$ 50 million. The selling price of apartment units is US$ 160 per sqm. SDs flat= US$3000 and for LIG it is = US$4480.

Design

\

The Project consists of Six Storied Buildings, with Type A for SDs=18.75sqm; (60%) and Type B for LIG= 28.00sqm (40%) (Figure 2). There are two types of unit plan in Bhashantek Rehabilitation Project Figure 2. Type A for slum dwellers (SD) and the type B for low income group (LIG) people respectively. The project failed to accommodate the target population due to flawed policy and the prices fixing beyond the affordability of the target population.

Housing Project Case Study 01

CDA Site and Service Residential Kolpolok project is at Bakolia area by the side of Sahamanat Bridge connecting Road. The total land area is 174 acres. The minimum size of Plot is 2.5 Katha, and maximum is 4.0 Katha (Table 4). The land acquisition Cost per Katha is 2.82lak taka (Tk), and land development cost is 68 thousand taka per Katha. So, the total cost per Katha is 3.5lak. This is also beyond the affordability limits of the target group. (Note: One US$=Tk. 85; One million=10Laks; 1 Katha=67sq.m).

Table 4: Detailed land use schedule of the Kolpolok Residential Project.

Lupinepublishers-openaccess-journals-Civil-engineering-Architechture

Housing Project, Case Study 02

Total land area of the site and service project is above 170 acres where 57.75 % area is used for residential plot, and 6.19% land area for commercial purpose and detail percentage of land use is shown in the Table 5. The total cost of the project is 3976761000 taka where the cost per Katha is 386656 taka (Table 5). But here the Oxygen and Kulgaon Road construction Included and for that the development cost of the project increased. The price of the plot is 6 lakh taka per Katha. According to the price per Katha the minimum Plot (3.00 Katha) price is 18lak and Maximum plot 6.00 Katha) is 36Lak (Figure 3) & (Table 5).

Figure 3:
Source: Chittagong Development Authority

Lupinepublishers-openaccess-journals-Civil-engineering-Architechture

Table 5: Cost of the Case Study project 02.

Lupinepublishers-openaccess-journals-Civil-engineering-Architechture

Analysis of Selected Site

In the site analysis, two important issues are focused:

a. The site surroundings, environments, and Land use of the site for housing and
b. The special potentiality of the site for the Rehabilitation of the landslide affected people for that site. None of the case studies seem to satisfy the target group affordability and spatial needs.

Brief Description of Site

According to Detail Area Plan (DAP,) 2008, a new township named Fathenagar New Township (FNT) was recommended in the zone DPZ 08 which is located at Hathazari and Raozan thana (North Chittagong) by the Hathazari Road and near Chittagong University, with a total area of 4700 acres where 2000 acres is reserved for the forest. It is connected to the City by Hathazari Road (N106) to the main city and by Nazirhat-Sholoshahar Railway. There is a different residential area for a housing project in the master plan and one site of around 42.16 acres is selected based as the demo study (Figure 4) & (Map 1).

Figure 4:Site Plan with adjacent land use.
Source: Chittagong Development Authority.

Lupinepublishers-openaccess-journals-Civil-engineering-Architechture

Map 1: Location of the Site. Source: Map from Google Earth.

Lupinepublishers-openaccess-journals-Civil-engineering-Architechture

The site

1. It is located at DPZ 08 zone of Chittagong DAP, and the area is defined as residential area in DAP
2. It is located at New Township area which is a proposal of CDA.
3. It is expected to be safe from natural disaster likelandslide, flood, and cyclone.
4. Good communication to the main city by Rail and Road. The nearest railway station is only 15min walking distance.
5. Landslide effected EWS people can go to their job easily by train which is cheaper and economically viable.
6. The market, school, and College are available in Fateyabad which is very near to the site.

Road network

The new site is just by the side of Hathazari Road (N106) which is an important national road and directly link with the city. Local bus and other transports are available, and the travel time is around half an hour.

Railway network

According to the master plan of the new township there is circular Rail track which will provide mass transport for those inhabitants. From Fatheyabad to Sholoshahar (Main City), the travel time is 20 minutes, and the fair is also low (05 taka) and affordable (5-7% of their income) for the poor people (Figure 4 & 5).

Figure 5: View of the site, Hathazari Road, and Fateyabad Rail station. Source: Field Survey.

Lupinepublishers-openaccess-journals-Civil-engineering-Architechture

Transport and communication

The site is connected to the city by Rail and Road. The following Charts Show the Distance and Fair of Bus and Rail from City to the site.

Economically feasibility analysis

From the primary survey, it is found that the monthly family income is around 8000 to 9000 taka, and they can spend 2500 to 3000 taka (30% of income) for housing of the informal sector of Chittagong. For special program from the government, they can get 2.5 to 3 lakh taka loan for housing. So, the price of the home should be up to 3 lakh Taka. The Bhasantek Gov Hosing project shows, the floor area required is about 200sft (18.5sqm). According to the housing policy land can be provided to the target people free. If the rehabilitation is a part of a normal housing, then the urban facilities and other areas can be shared which reduce the land development cost of that people, and the same time the total cost comes down. On the other hand, the construction cost of the building has to be minimum with minimum architectural and structural requirements. Considering housing project for informal sector as a part of housing the cost of the unit is almost 3 lakh taka. If the rehabilitation project has to be taken individually then the Land Acquisition cost which has considered as free will be almost 84000 (in combine project it is only 34800 taka) taka per family, and it is a great burden for the government. On the other hand, total unit cost will be more and if the facilities like school and clinic will be provided separately. If separate Plot is provided then only for aunit, (unit area 22.3sqm, Plot area 34sqm) the land acquisition cost is 1.5 lakh which is more burdain for government to give it free per family. Again, land development cost is 0.85 lakh, and Building cost is 2.9 lakh which is not affordable for the poor people and the plot size also too small to build separate building. In this way the poor people can get a shelter with free land where maximum family will share the land according to their demand and within present building construction rules (Table 6).

Table 6: Fair of bus and Train from City to the proposed site.

Lupinepublishers-openaccess-journals-Civil-engineering-Architechture

Proposal of Housing Scheme for Low Income People

Conceptual layout plan

The main concept of the proposed layout housing plan is to create a central open space with facilities like playground, park, etc. which would be open to the south to enjoy the wind flow from south direction. Hierarchies of open spaces in the different residential zone are provided which can be gathering play space for local different age groups.

Land use

The housing colony is proposed with different land use where the maximum percentage of area is residential. The Educational, recreational uses are proposed at the centre of the colony. Other land uses such as Commercial (Kitchen Market and Shop), Community (Community Center and Mosques) and Clinic (Health facilities) are proposed at the edge of the site.

Residential zoning, FAR, and height

In the colony zoning is proposed according to a different type of consumers. The housing for poor people is separate from the general residential area. The area is divided into three part and the buildings are proposed by using MGC with the maximum floor is six (Ground +5). The 2.5 and 3.0 Katha plot are mainly for lower income and middle-income group, for that, these types of plot are proposed in a residential zone. On the other hand, 4.0 Katha is for higher middle class and 5.0 kata is for higher income group. The apartment block also is in the different residential zone with FAR 5.25 and the floor number is 13 (Ground +12, with MGC 50%). Here basement floors may be required for parking and ground floor is also considered for parking which are not FAR included.

Proposal for poor people

For the Rehabilitation people, the main aim is to provide safe shelter with minimum cost. At the same time the community demand, rules and regulation, requirements, environmental issues also have to be considered.

Land area and land use

Considering the total unit number of family around 2100 the total area for Landslide-affected people is around 5 acres including road, nursery school/children play area and community center. Here the residential use is 3.5 acres, and the floor area is on the base that land area. The Ground Coverage not more than 60% and the Minimum distance of two building is 5 meters (as per rules minimum distance 4.25 meter). Other urban amenities like market, health and School have to be shared with General housing scheme (Plan 1).

Plan 1: Land use proposal of the Scheme.

Lupinepublishers-openaccess-journals-Civil-engineering-Architechture

Built-up area and use of floor

Considering the survey and Gov. Rehabilitation project at Mirpur Dhaka, the floor area is 240sqft or 13sqm and the maximum floor no is 5. No use of lift which increases the construction and maintaining cost. The building is proposed with a double-loaded corridor with minimum two stairs to minimize the service area of the building. In ground floor, the built-up area is 50% use for house and rest 50% would be vacant (no wall) for bicycle/motorbike parking, socio-economy activity for that people. According to Building construction act the maximum FAR is 5.25 (with MGC 50%) but taking the lower value of FAR the MGC is 65%. Considering MGC is 60 to 63% and actual taking Far 3.25 to 3.50. The total floor no is 5.5 (FAR included), the total floor area for Housing unit is around 43600sqm.

Proposal for housing for general people

In a housing project Plotted development and apartment are the main two types for residential projects. From literature review, it can be stated that the demand of apartment is more in Chittagong and on the other hand according to case study plot is still in demand. So here the project is a combination of Plot and apartment for residential use. Though 60% land is for the plot but according to FAR the total floor area is 158763 sqm but the house unit number is 1200 and 40% land for an apartment with floor area 187033 sqm (base on FAR) where the house unit number is 1550. Detail of Plot and apartments’ calculation are described below (Plan 2).

Plan 2: Residential Zoning, FAR, and Number of Floor of the Scheme.

Lupinepublishers-openaccess-journals-Civil-engineering-Architechture

Land area and types of plot

The total land area for the plot is 11.17 acres which are almost 59.8% of the residential area. The plots are mainly four types according to its area. The unit of area is Katha and one Katha are 720sqft. The flowing tables show the percentage and number of different types of plot (Table 7-9).

Table 7: Different type of Plot a) percentage and Cost b) size of plots.

Lupinepublishers-openaccess-journals-Civil-engineering-Architechture

Table 8: Percentage of Different type Apartment.

Lupinepublishers-openaccess-journals-Civil-engineering-Architechture

Table 9: Population Calculation.

Lupinepublishers-openaccess-journals-Civil-engineering-Architechture

Details area calculation for apartment

The total land area for apartment is 7.6 acres, and there four type apartments are considered according to the demand of apartment in Chittagong. In the proposed scheme, the minimum apartment size is 850sqft (79sqm), most demandable area is 1250 to 1500sqft (116.17 to 139.41sqm) and the maximum apartment area is 1700sqft (147.99sqm). This apartment size means the gross unit area which includes net unit area, lift, stair, lobby; corridor and others FAR included area. Far excluded areas like Veranda, Gardens are not included here. According to Building construction rules the playground is 0.76 acres (10% of Land Area) and in the layout plan, it is proposed at the centre of apartment land area. The total apartment (residential use, FAR included) floor number is 12 Nos with using Maximum Ground Coverage (50%), Ground floor is considered for parking and basement floor/floors also proposed for parking which are FAR excluded.

According to FAR chart, the value of FAR is 6.00 then the Total floor area is 184600sq.m and the following Table 8 show the detail calculation of FAR for of different types apartments. The urban facilities are an important issue for a successful housing project. The requirements of that area have to maintain in any housing projects. The percentage of saleable area is not more than 70% and according to case study, the residential area is around 53 to 60%. For education three types school area proposed which Nursery or day care center, Primary school, and Secondary School. Different Nursery or day care centers are proposed in different residential zones with playground. One primary and one secondary school are proposed at the center of the colony and students of that colony are enough for that school (30% of total population). Two community centers with the mosque (considering 90% populations are Muslims) and Market with parking are located at the periphery of the site where outside people can join. A Central Playground for all at the center of the layout plan and a Park is suggested at the south part of the site by the bank of the cancel (Figure 6).

Figure 6: 3D view of the proposed Housing Scheme.

Lupinepublishers-openaccess-journals-Civil-engineering-Architechture

Figure 7:

Lupinepublishers-openaccess-journals-Civil-engineering-Architechture

Table 10 In Plot, more profit is proposed for the five Katha which is mainly for the upper middle and high- income group, and they will get more FAR benefit also. On the other hand, three and four Katha plots are meant for the middle-income group which is with moderate profit and 2.5 kata are special consideration for the lower income group people with less profit. Again, four types apartment are proposed in the project where the largest area is 1700sqft (158sqm) for HIG people with maximum profit. Another two-type apartment which area is 1250sqft (116.1sqm) to 1500sqft (139.4sqm), is proposed for MIG and the profit also is in moderate range and less than the market price of the apartment. Here apartments also proposed for the LIG people with 850sqft (79sqm) and the profit is also lowest. Finally, the project is expected to be successful where the profit is 164, 68, 75653 taka (average 31.24 %). The investment and the Bank interest are not calculated.

Table 10: Total Cost and Profit of the Scheme.

Lupinepublishers-openaccess-journals-Civil-engineering-Architechture

Conclusions

In the housing policy, the government has committed to provide housing for all including the poor of the informal sector. Detail planning is required where all categories of people are addressed for housing. There are so many problem and limitations to provide housing for the target group and the main problem is affordability. If individual housing project is prepared for them, then the price of plot or apartment would be high and beyond their affordability. In a combined housing scheme, the price of the house can bring within their buying capacity considering the land to be free to them. The proposed scheme where the land area is 42 acres, almost 2000 poor family can be relocated where the transportation, job and other basic demand can be fulfilled. This type of scheme can be applicable for the housing of all kind of informal sector people including the vulnerable people all over Bangladesh.


Read More Lupine Publishers Civil and Architecture Articles : 
https://lupinepublishers-civilengineering.blogspot.com/

https://lupinepublishers.com/civil-engineering-journal/fulltext/informal-sector-housing-scenario-analysis-for-chattogram-bangladesh-a-way-forward.ID.000180.php

Read More Lupine Publishers blogger Articles : https://lupinepublishers.blogspot.com


Lupine Publishers| Modeling Heterogeneous Grades of Aggregate on Partial Replacement of Metakaolin on Compressive Strength of Concrete


Abstract

Aggregate in different size has been known to be one of the concrete properties in strength development of any grades. The study evaluates the sizes of aggregate in heterogeneous condition to determine their various rate of effect to the optimum required strength. These are determined on the design grade required based on the imposed loads evenly distributed, the study precisely monitored the impact of heterogeneity of aggregate size at different mixed proportion, the size and shapes of aggregate were considered in the study integrated with Metakaolin content at different dosage, the study observed linear growth to the optimum level recorded at twenty eight days of curing, various predictive values were generated to monitor the variationof developed strength influenced by heterogeneous aggregate size, it is observed that the larger the size, the lower surface for the development of the gel bonds, these were monitored and evaluated based on the developed modeling techniques, other observation shows that the bigger size of aggregate on heterogeneous level inconcrete mix prevent the uniformity of load distribution,when it experience stress. Compactions of the concrete were other parameter that displayed its effect on the variation of strength as it experienced the effect on this condition, while others include the cement-aggregate ratios and curing time. The predictive values were compared with experimental data for model validation, and both parameters developed best fits correlation, the study is imperative because the effect of aggregate size and shapes has be evaluated, there rate of impact on concrete strength partially replaced with Metakaolin has been determined.

Keywords:Modeling heterogeneous, Aggregate Metakaolin and compressive strength

Introduction

The pursue for high strength by experts to monitor the growth rate of high-performance concretes has definitely improved substantially in this current time; it has been observed that there high demands for high performance concrete nearly all construction industries. It has observed in the these last three decades, the level integration of cementitious materials, these includes such as fly ash, silica fume and ground granulated blast furnace slag, such modifiers are currently integrated fully, this materials are applied as partial cement replacement materials, more so studies has expressed it clearly that it has experienced meaningfully improvement on the strength and stability characteristics of concrete, comparing it with ordinary Portland cement (OPC) alone. Such examination has definitely provided adequate required curing [1-4]. More so in this current state of scientific approach, there is need for high strength concrete, addictive such as silica fume has been observed to be more useful [5,6].These types of additive’s have created serious impact developed good particle packing based on its level of strong pozzolanic property, this implies that it has escalated the resistance of concrete in these aggressive environments, more so Metakaolin (MK) according to [7,8]. Furthermore, materials such as calcined kaolin, and other type of pozzolan, these materials are generated from calcinations; it has the capability to be applied as substitute silica fume material. In nation like India MK has generated a very elevated measure of quantities, these are procedures of generating kaolin mineral, these concepts are very wide spread that has proven it reserves availability in most nations [9-13]. Previously, numerous studies have shown high rate of interest in MK, because it has been observed to possess both pozzolanic and microfiller as its characteristics [4,13-15]. Such application has proven successfully development of high strength, including self-compacting concrete applying mathematical modeling [16,17].

Theoretical Background

Materials and Method

Experimental procedures

Compressive Strength Test Concrete cubes of size 150mm×150mm×150mm were cast with and without copper slag. During casting, the cubes were mechanically vibrated using a table vibrator. After 24 hours, the specimens were demoulded and subjected to curing for 1-90 days and seven-day interval to 28 days in portable water. After curing, the specimens were tested for compressive strength using compression testing machine of 2000KN capacity. The maximum load at failure was taken. The average compressive strength of concrete and mortar specimens was calculated by using the following equation

Compressive strength (N/mm2) = Ultimate compressive load (N)
Area of cross section of specimen (mm2)

Results and Discussion

Table 1-7; Figures 1-7. The figures explained the behaviour of the gravel size and shape on the bond from variations of compressive strength at different water cement ratios and curing age. The trend at different figures experienced linear increase to optimum level recorded at twenty eight day of curing, but the compressive observed at different figures experienced the expected variation of strength that determined the effect of heterogeneous aggregate size, because decrease of the strength was experienced at different figures, even though linear trend was observed in all the figures, the impact of the heterogeneity on the concrete shows that larger maximum size aggregate gives lower surface area for developments of gel bonds, this is responsible for the lower strength of the concrete. Secondly bigger aggregate size causes a more heterogeneity in the concrete which will prevent the uniform distribution of load when stressed. The behaviour of the model concrete on Metakaolin as partial replacement for cement experience similar condition, but the developed model concrete grades are high strength, the study observed the effect from the aggregate heterogeneity impact on variation of compressive strength, but still maintained the influenced from the heterogeneous impact in all the figures. The predictive values in figure seven and eight explained the variation of water cement ratios against curing age, the graphical expression shows the rates of decrease in strength as the water cement ratios increase, such experience were determined in the study, numerical simulation shows results expected of the material based on the behaviour of the compressive strength, these experimental values for model validation maintained similar trend expressing best fit correlations.

Table 1: Predictive and experimental values of compressive strength at different curing age.

Lupinepublishers-openaccess-journals-Civil-engineering-Architechture

Table 2: Predictive and experimental values of compressive strength at different curing age.

Lupinepublishers-openaccess-journals-Civil-engineering-Architechture

Table 3: Predictive and experimental values of compressive strength at different curing age.

Lupinepublishers-openaccess-journals-Civil-engineering-Architechture

Table 4: Predictive and experimental values of compressive strength at different curing age.

Lupinepublishers-openaccess-journals-Civil-engineering-Architechture

Table 5: Predictive and experimental values of compressive strength at different curing age.

Lupinepublishers-openaccess-journals-Civil-engineering-Architechture

Table 6: Variation of water cement ratios on experimental values of compressive strength at different curing age.

Lupinepublishers-openaccess-journals-Civil-engineering-Architechture

Table 7: Variation of water cement ratios on experimental values of compressive strength at different curing age.

Lupinepublishers-openaccess-journals-Civil-engineering-Architechture

Figure 1:Predictive and Experimental Values of Compressive Strength at Different Curing Age.

Lupinepublishers-openaccess-journals-Civil-engineering-Architechture

Figure 2: Predictive and Experimental Values of Compressive Strength at Different Curing Age.

Lupinepublishers-openaccess-journals-Civil-engineering-Architechture

Figure 3: Predictive and Experimental Values of Compressive Strength at Different Curing Age

Lupinepublishers-openaccess-journals-Civil-engineering-Architechture

Figure 4:Predictive and Experimental Values of Compressive Strength at Different Curing Age.

Lupinepublishers-openaccess-journals-Civil-engineering-Architechture

Figure 5: Predictive and Experimental Values of Compressive Strength at Different Curing Age.

Lupinepublishers-openaccess-journals-Civil-engineering-Architechture

Figure 6: Variation of Water Cement Ratios on Experimental Values of Compressive Strength at Different Curing Age.

Lupinepublishers-openaccess-journals-Civil-engineering-Architechture

Figure 7: Variation of Water Cement Ratios on Predictive Values of Compressive Strength at Different Curing Age.

Lupinepublishers-openaccess-journals-Civil-engineering-Architechture

Conclusions

The study monitors the behaviour of Metakaolin content as partial replacement on strength development influence by heterogeneous aggregate within curing age of [18,19]. Mixed design of concrete grades were carried out integrating Metakaolin content to monitor the behaviour of the material in terms of its bond compared to other addictives, but the major study carried out were to monitor the variation of strength development from heterogeneity of aggregate since, it is one of concrete properties. Metakaolin substance partially replaced cement that react with the concrete properties to generate these strength at different curing time, the study expressed graphically in linear trend at various water mixed ratios proportions, but the strength development were observed to vary compared to different mixed proportion, aggregate as concrete property were influenced on the mixed design to monitor the effect of strength growth, this were observed based on the shapes and variation of size, the application of this concrete property were experienced to determine its rate of effect on concrete strength development from variation of aggregate size. It is observed that the larger the size, the lower the surface for the development of the gel bonds, these were monitored and it was observed that the lower strength of concrete were experienced based on the effect of the aggregate heterogeneous size, other observation shows that the bigger size of aggregate on heterogeneous level in concrete mix prevent the uniformity of load distribution, when it experience stress. Compactions of the concrete were other parameter that displayed its effect on the variation of strength development, while other includes the cement-aggregate ratio and curing time. The application of modeling and simulations express details on the other parameters that played roles in the variations of concrete strength, Metakaolin as partial replacement expressed it strength as expected on its rate as a parameter, but the aggregate size at different grades in mixed design were the detail and precise study were carried out, the variations are influenced on the strength development that has been determined.


Read More Lupine Publishers Civil and Architecture Articles : 
https://lupinepublishers-civilengineering.blogspot.com/

https://lupinepublishers.com/civil-engineering-journal/fulltext/modeling-heterogeneous-grades-of-aggregate-on-partial-replacement-of-metakaolin.ID.000179.php

Read More Lupine Publishers blogger Articles : https://lupinepublishers.blogspot.com


Lupine Publishers| Modeling the influence of water cement ratios and slump partially replace cement with iron slag and silica fumes on compressive strength on High strength concrete


Abstract

The study define the behaviour of silica fumes and iron slag as partial replacement for cement, the study isto monitor the extend water cement ratios and workability of concrete can influence the growth rate of concrete strength, themodel grade of concrete were designedapplying partial replacement, thesewere adoptedin other to achieved the required target strength, such conditions were applied, but predominant influence were paramount goalthe study want to achieve, this carried outto determined the effect of these stated parameters in the study, modeling techniques were adopted, these concept includes modeling and simulating, these parameter applying this concept is to determine the extent of influence in the study it will also expressed various rate of effect on the growth rate of designed concrete grade, it is observed thatthe surface areaof concrete’s increases, particularly with the addition of fine aggregates, thisalso implies that it has a high demand for water. The study considered these reactions and monitors the extent from the mixed design; the increased in water leads to a higher water-to-cement ratio. Thus monitoring the variation effect of water cement ratios and it workability’s expressed the predominant influence and its variation that was observed on the study. The researchalso expressed high significant rates ofother parameters, this includesvariation ofthe addictive dosage, compaction of concrete, permeabilityand porosity at differentmodel concrete mix,the growth rate from the model concrete to generate the target strength observed initial inner, it remains in that conditiondue to it particle size that is finer than cement. it complement the fines modulus of concrete, thus provide a ball-bearing effect that improves thixotropic behaviour, this influence modify concrete viscosity, while slag expressed it significant on the model concrete as itreduced permeability, improved resistance to chemical attack. The study observed the influenced from these two addictive based on these stated effect on the strength development influenced by the influential parameters, the derived model simulation were compared with experimental values and both parameters expressed best fits correlation, Experts will definitely fine these tools as another conceptual technique in developing different concrete model with partial replacement of silica fumes, Iron Slag to attain any target strength of concrete design.

Keywords: Modeling; Silica fumes; Iron slag; Compressive and Cement

Introduction

Several researches has been carried out studies to monitor the use of some localized materials which includes iron slag waste tyre and Rice husk Ash as partial replacement of cement. There are numerous materials known to be concrete properties such as fine and coarse aggregates in strength development, these techniques are numerous in recent literatures [1-7], the techniques definitely has produced high percentage result, the use of waste tyre has established wonderful feasibility using gargantuan amounts from waste tyre in concrete products. There are materials such as the used of plastic waste, these material are product familiar to environmental issues that is contemporary around the globe Choi et al. [8], recent research were carried out to evaluate the influences of waste PET bottles aggregate on properties of concrete. The study has developed concept of applying waste tyre and bottles, it has reduced it by 2-6% of normal weight concrete. Marzouk et al. [9] carried out comprehensive research on the use of waste consumed plastic bottle, such materials are applied as partial replacement for sand; it was examined from the research carried out by monitoring and observed the density that was lowered when the PET aggregate exceeding 50% by volume of sand. Suganthy et al. [10] another investigation carried out shows the reduction in weight of concrete, while that of the plastic content experienced an increase Ode and Eluozo [11]. Marzouk [9] more so, studies were carried out to examined the decrease of compressive strength from plastic concrete; this techniques was applied on sand replaced with plastic. Al-Manasser and Dalal (1997) other studies was carried out by on the effect of plastic on concrete mix. The observation was that split tensile strength experienced reduction as the plastic content increased. Batayneh et al. [12] the expression was on split tensile strength and the flexural strength of concrete mix including slump on the replacement, it was observed that the plastic content went up. Numerous research and investigated the strengths of plastic concrete, as Batayneh et al. [12] mentioned that the integration of ground plastic on concrete had influence on its compressive strength [13,14]. Naik et al. [15] examined the influence from postconsumer waste plastic in concrete as a soft filer [16-20].

Theoretical Background

Governing equation

Nomenclature

C = Compressive strength
A(x) = Porosity of concrete
B(x) = Additive and Cementious materials
α1x = Water Cement Ratio
x = Curing Age

Transform the above Bernoulli’s Equation to a linear first order DE gives:

Use I.F to Solve (2) above
Hence, the general Solution becomes:

Materials and Method

Experimental Procedures: Test Compressive Strength of Concrete cubes and size of 150mm×150mm×150mm were cast with and without copper slag. During casting, the cubes were mechanically vibrated using a table vibrator. After 24 hours, the specimens were demoulded and subjected to curing for 7 and 56 days and seven-day interval to 56 days in portable water. After curing, the specimens were tested for compressive strength using compression testing machine of 2000KN capacity. The maximum load at failure was taken.

The average compressive strength of concrete and mortar specimens was calculated by using the following equation 5.1. Compressive strength (N/mm2) = Ultimate compressive load (N)

Area of cross section of specimen (mm2)

Results and Discussion

Table 1-7; Figures 1-7.

Table 1: Predictive and experimental values of compressive strength at different curing age.

Lupinepublishers-openaccess-journals-Civil-engineering-Architechture

Table 2: Predictive and experimental values of compressive strength at different curing age.

Lupinepublishers-openaccess-journals-Civil-engineering-Architechture

Table 3: Predictive and experimental values of compressive strength at different curing age.

Lupinepublishers-openaccess-journals-Civil-engineering-Architechture

Table 4: Predictive and experimental values of compressive strength at different curing age.

Lupinepublishers-openaccess-journals-Civil-engineering-Architechture

Table 5: Predictive and experimental values of compressive strength at different curing age.

Lupinepublishers-openaccess-journals-Civil-engineering-Architechture

Table 6: Variation of predictive water cement ratios on compressive strength of concrete.

Lupinepublishers-openaccess-journals-Civil-engineering-Architechture

Table 7: Variation of experimental water cement ratios on compressive strength of concrete.

Lupinepublishers-openaccess-journals-Civil-engineering-Architechture

Figure 1:Predictive and experimental values of compressive strength at different curing age.

Lupinepublishers-openaccess-journals-Civil-engineering-Architechture

Figure 2: Predictive and experimental values of compressive strength at different curing age.

Lupinepublishers-openaccess-journals-Civil-engineering-Architechture

Figure 3:Predictive and experimental values of compressive strength at different curing age.

Lupinepublishers-openaccess-journals-Civil-engineering-Architechture

Figure 4: Predictive and experimental values of compressive strength at different curing age.

Lupinepublishers-openaccess-journals-Civil-engineering-Architechture

Figure 5: Predictive and experimental values of compressive strength at different curing age.

Lupinepublishers-openaccess-journals-Civil-engineering-Architechture

Figure 6: Variation of predictive water cement ratios on compressive strength of concrete.

Lupinepublishers-openaccess-journals-Civil-engineering-Architechture

Figure 7: Variation of predictive water cement ratios on compressive strength of concrete.

Lupinepublishers-openaccess-journals-Civil-engineering-Architechture

The study explained the trend based on the concrete model applied in the mixed design, the reflection from figure one to seven , explained the trend in all the figures as it displayed linear growth were gradual increase were observed to the optimum values recorded at twenty fifty days of curing. but the reaction from all figures displayed linear increase in gradual process but with different compressive strength to the optimum level, the linear strength in all the figures that experienced different values are within seven and fifty six days, the predictive model thoroughly developed this variation, in different figures base on the water cement ratios and slump, similar condition were experienced on the experimental values, this were applied to validated the model, linear growth rate displayed predominantly based on the behaviour of silica fumes and iron slag, the research carried out explained the rate of concrete mixed designed proportion in all the figures, the research generated model that was applied by Silica fume and Iron Slag, the experimental values were applied at different mixed design within 7 and 56 days of curing, applying silica fumes and iron slag on the developed compressive strength of concrete. The research examined the developed concrete model that partially replaced cement with these two materials, the study predictive using these two modifiers Silica and Iron Slag similar to Parthi et al 2018 experimental values, the experimental values between 7 and 56 although Parthi 2018 curing days are within 7-28 days, these were in agreement but the study went further to examined other days that were not considered by Parthi et al 2018 with predictive parameters, these validated the simulation parameters, the dosage percentage for Silica fume and Iron Slag was at different percentage, the predictive simulation values at within two admixture observed the highest compressive strength generated from silica fumes and iron slag, the study examined the compressive strength from various admixtures by replacing cement with these two substance, at different water cement ratios, the influenced from different dosage of silica fumes and iron slag has expressed results within 7 and 56 days of curing age. More so, the simulation were able to monitor the effect from variation of slump and water cement ratios, other concrete characteristic that developed mechanical properties, this simulation generated variations influence from these parameters, it was observed that the system were affected by these variables and it was reflected on the growth rate of the compressive from different curing age.

Conclusions

The research work expressed the behaviour of the two modifiers on concrete strength that is applied within the two different admixtures, the variations of dosage and curing age were observed to determine the behaviour these material to an extent the study explained the growth rate of compressive strength with different water cement ratio, but with variation of these admixtures within 7 and 56 days of curing, while the dosage are at different percentage, but further study were carried out were increase in dosage and curing age was considered, others includes variation of slump on various rate of the mixed concrete workability’s, the concept applied was modeling techniques, the study explained the behaviour of the concrete model by simulation to generate the predictive values, the behaviour of the materials generated various growth rate based on different factors, the predominant influential parameters such as variation of slump on concrete workability’s and water cement ratios were able to expressed their various impact on concrete design. These techniques were observed to monitor other concrete characteristics that could influence the concrete model such as compaction, permeability, and porosities, this adopted applications were validated with experimental values, the study was also compared with study by Parthi et al 2018. The research were improved on the model concrete whereby the curing days were extended to fifty six days, this concept were integrated in the system, the predictive values further simulated the these other days that were not considered by Parthi et al 2018, the variation affected other days of curing that were not by Parthi et al 2018, this observation reflected growth rate of other days of curing that were not considered, the research developed best fits correlation between 7 and 56days, this development expressed the behaviour of the model partially replacement of cement with iron slag and silica fumes, influenced from slump and water cement ratios within 7 and 56 days of curing were comprehensively observed in the study, these strength development from predictive and experimental values was based on these factors, the slag played other influential roles as it serve as fillers within the void of the model concrete, the study is imperative because other curing time and its strength applying modeling has been developed, experts can applied this concept to monitor or predict other strength of this model grade of concrete for other constructions activities.


Read More Lupine Publishers Civil and Architecture Articles : 
https://lupinepublishers-civilengineering.blogspot.com/

https://lupinepublishers.com/civil-engineering-journal/fulltext/modeling-the-influence-of-water-cement-ratios-and-slump-partially-replace-cement-with-iron-slag.ID.000178.php

Read More Lupine Publishers blogger Articles : https://lupinepublishers.blogspot.com


Lupine Publishers| Informal sector housing Scenario Analysis for Chattogram, Bangladesh: A Way Forward

  Abstract Population growth rate, urban migration and natural disasters are making, the chronic shortage of housing in the develop...